Solidification Simulation
Two simple models, equilibrium solidification and Scheil solidification, have been integrated into Pandat™ for calculating solidification pathways. The equilibrium model, also called the lever rule model, assumes that complete diffusion occurs in both liquid and solid phases, and the compositions of solid and liquid always follow the phase boundaries defined by the equilibrium phase diagram. The fractions of liquid and solid can be calculated through the lever rule. In contrast, Scheil solidification assumes that no diffusion occurs in the solid phases, that the composition of liquid phase is uniform (infinite diffusivity in liquid) and that local equilibrium at the solid-liquid interface is always maintained. The Solidification Simulation function calculates the solidification path of an alloy using either the lever rule or Scheil model as being decided by the user.
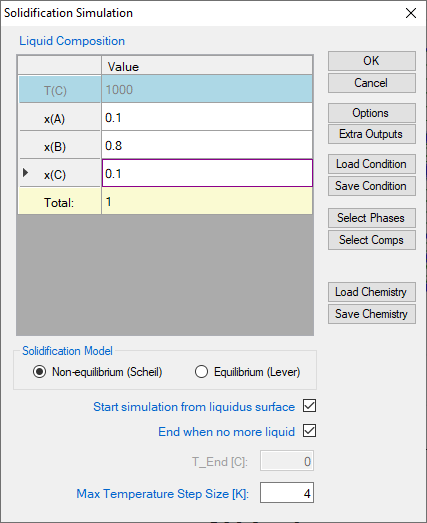
Go to PanPhaseDiagram on the menu bar and select Solidification Simulation or click the ![]() button on the tool bar. The dialog box as shown in Figure 1 allows the user to set up the alloy composition for the solidification simulation. User can choose the simulation under either Non-Equilibrium (Scheil) or Equilibrium (Lever Rule) condition. There are two check boxes at the bottom of the input dialog: Start simulation from liquidus surface, and End when no more liquid. If both boxes were checked, the solidification simulation will be carried out in the temperature range when solid start to form from liquid (liquidus surface) to the point when liquid just completely disappear. Pandat™ software will find these two points automatically. If one or both of the check boxes are not checked, user will need to define the start or/and the end temperature for the solidification simulation proceeds.
button on the tool bar. The dialog box as shown in Figure 1 allows the user to set up the alloy composition for the solidification simulation. User can choose the simulation under either Non-Equilibrium (Scheil) or Equilibrium (Lever Rule) condition. There are two check boxes at the bottom of the input dialog: Start simulation from liquidus surface, and End when no more liquid. If both boxes were checked, the solidification simulation will be carried out in the temperature range when solid start to form from liquid (liquidus surface) to the point when liquid just completely disappear. Pandat™ software will find these two points automatically. If one or both of the check boxes are not checked, user will need to define the start or/and the end temperature for the solidification simulation proceeds.
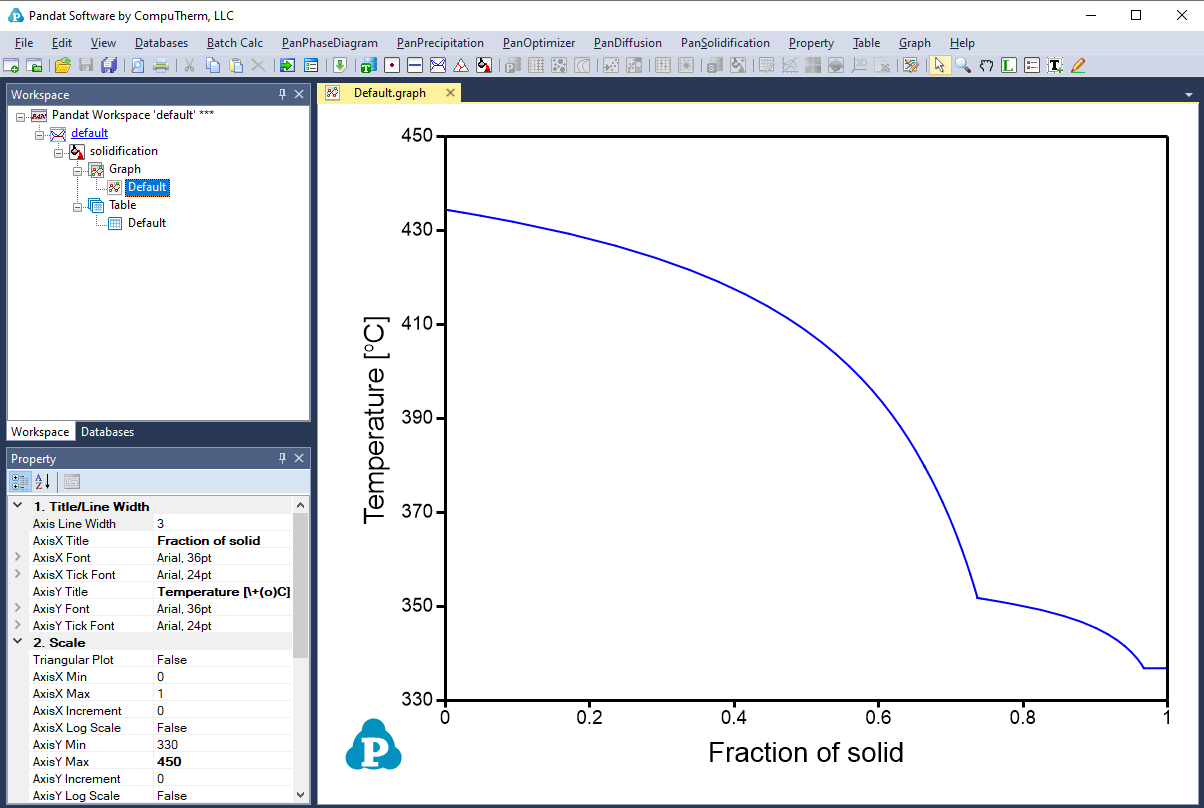
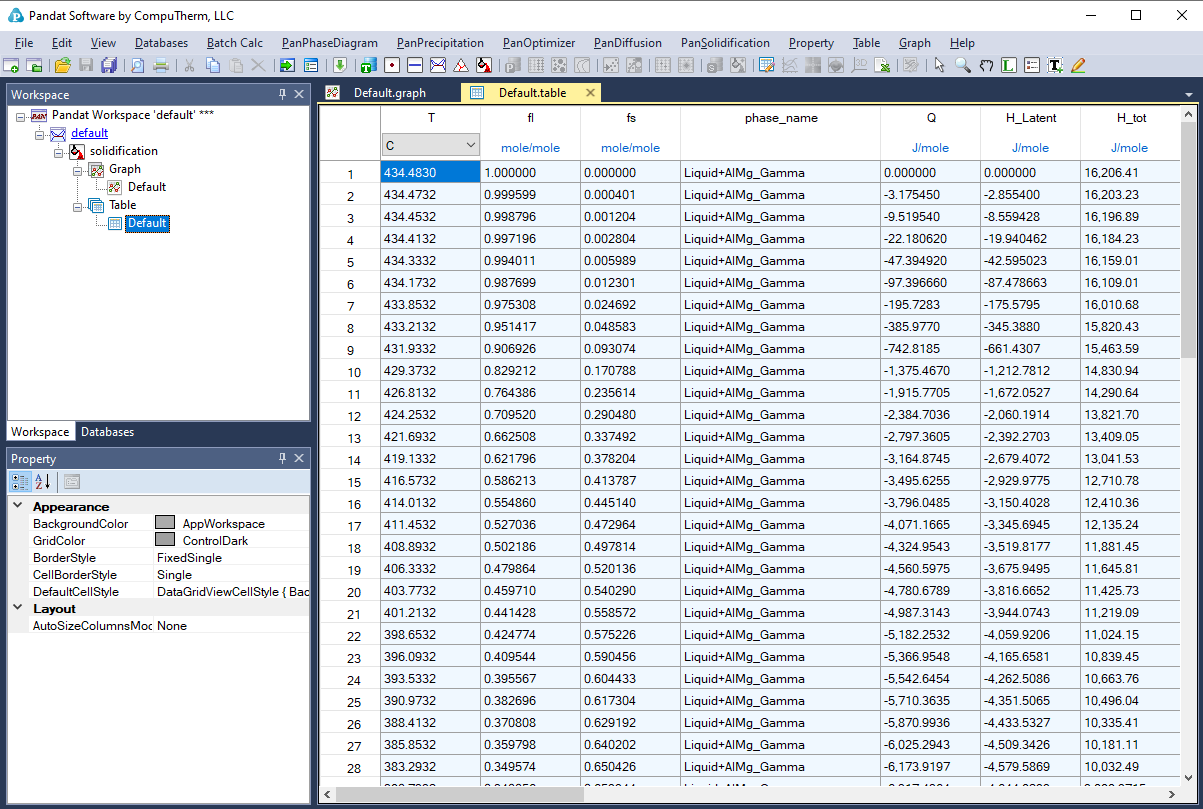
The results are displayed in either Graph View or Table View. Figure 2 and Figure 3 show the graph view and table view for the solidification simulation results with the calculation condition shown in Figure 1. Extensive operations on Graph and Table, such as labeling and adding legend, have been discussed in detail in Section Graph and Section Table
PanSolidification module considers the back diffusion in the solid phase during solidification. Detailed description on PanSolidification module is in Chapter PanSolidification.